In recent decades, the world has seen a real boom in the automotive industry. In 2010, for the first time in history, the number of cars exceeded 1 billion. It is projected to reach 1.8 billion by 2040. Mass motorization drives demand for oil and is one of the main causes of air pollution and loss of life. Russia is no exception. The article will answer the question of how many cars there are per person in Russia.
What is motorization?
This term means the provision of the population with road transport. Its value is calculated based on the average number of cars per thousand inhabitants.
The geography of motorization is rather heterogeneous. The highest provision of passenger cars is noted in the USA, Canada, Germany, Japan, Australia. In these countries, there is about one car per person.
Most low level motorization in Africa. There, in a number of countries, less than 10 cars are registered per thousand people. According to this indicator, Russia is in one of the first places in the world, but it is inferior to some developed countries, but ahead of China.

However, in recent years, there has been a rapid growth in the automotive industry in China and India. Therefore, the positions of these countries are rapidly rising and may in the foreseeable future approach the level of developed countries.
Motorization of the population of Russia
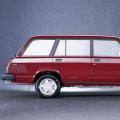
Development road transport in our country it happened gradually. At the beginning of the 20th century, the so-called horse-drawn transport still prevailed, and cars were rather exotic. Their mass distribution was noted in the 30s of the last century. As a result, in the third decade, horse-drawn transport gave way to wheeled transport. But private cars were still rare. This situation continued until 1970.
Level of motorization in regions
Moscow was the leader in terms of the provision of the population with passenger transport. In 2002, it had an indicator of 256 cars / 1000 people. However, by 2011, Primorsky Territory became the leader (580 cars / 1000 people), and the Russian capital went up to 8th place. The Kamchatka Territory, the Kaliningrad Region, the Murmansk, Kaluga and Pskov Regions, and the Moscow Region were also ahead of it. This was probably due to the congestion of the capital with cars and the high availability of the metro and other types public transportincluding taxis.

In general, across the country by 2010, the number of cars per thousand inhabitants was 249 units. In 2014, this figure increased to 317. The high level of car availability was noted in Vladivostok, Tyumen, Krasnoyarsk, Surgut and Moscow. However, Moscow's rating continued to fall and in 2014 it consolidated in 10th place.
As for Primorye, a good indicator here is explained by the proximity of Japan and China, which are among the world leaders in the production of cars.
Dynamics of motorization by years
Russia has seen a rapid increase in the number of cars since 1970. Then there were only 5.5 cars per thousand inhabitants. Growing numbers personal cars happened even in the crisis 90s. By 2016, the figure reached 285 vehicles per 1000 people.
However, the situation in Moscow is somewhat different from trends in other regions and in the country as a whole. The maximum motorization was recorded here in 2014. Then the number of transport units per capita was 311. However, by 2016 this figure dropped to 308 vehicles.
Sales statistics
The crisis of recent years has affected the levels of car sales. So, in 2016, 1,425,791 units were sold, and a year earlier - 1,601,527 vehicles. The gradual decline has continued since 2012. However, 2017 was an exception, and cumulative sales rose to 1,596 personal cars. The reason could be the relative stabilization of the situation in the country, as a result of which the fears of Russians somewhat decreased and the so-called deferred demand triggered.

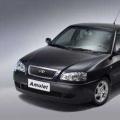
Most often, the choice of the population was Lada. Kia, Renault, Hyundai and Toyota have significantly less sales. However, the popularity Kia rio has grown dramatically over the past year.
The least purchased cars in our country were cars of such brands as: Volvo, Porsche, Subaru, Land rover, Audi and some others.
In 2017, the largest increase in sales fell on Lada (17%). The worst results on the dynamics of "Toyota" (0%). By contrast, sales of premium cars have sagged. The biggest losses were: Audi (18%), UAZ (15%), Porsche (3-8%).
Forecast for 2018
For gasoline as well as growth recycling fee and excise taxes can negatively affect the desire of citizens to purchase a car. First of all, this will affect the sales of imported cars. However, experts still expect new growth, but not as significant as in 2017.
How many cars are registered in Russia?
According to RIA Novosti, over 44 million were registered in Russia in 2016 passenger cars... There were more than 6 million trucks. There were also 2.2 million motorcycles and 890 thousand buses, 3 million towed vehicles. The total number of cars is increasing annually by about 1.5 million. These are mainly cars. It is rather difficult to answer the question how many expensive cars are in Russia. Recently, however, people are giving preference to more budget options for cars, and the share expensive foreign cars reduced.
If we answer the question: how many foreign cars there are in Russia, then there are 25 million of them on our roads. Of these, 6 million were produced in Russia. The number of vehicles operating on natural gas... Now there are 1.4 million.
Electric vehicle sales
Feature of Russian automotive market is that the share of electric vehicles in the total mass of sales is extremely insignificant. At the beginning of 2017, there were only 920 electric vehicles in the country, while there are millions of them in the world. About a third of them travel on the roads of Moscow. In other constituent entities of the Russian Federation, there are very few such machines.

Most electric cars in our country falls on nissan model Leaf, of which there are 340 units. On the second location Mitsubishi i-MiEV (263 pcs.). And how many Tesla cars are there in Russia? The share of this manufacturer is also significant: it accounts for 177 copies.
The fourth positions are taken by Lada Ellada. There are 93 such machines. The rest of the models are represented by single copies. So far, the authorities are in no hurry to popularize this type of transport, and they see the solution to environmental problems associated with cars in the transfer of vehicles to gas fuel... Most likely, Russia will be one of the last in the world to switch to electric transport.
How many trucks are there in Russia
In 2018, there was an increase in the park trucks... In January of this year, 4.8 thousand cars were sold, which is 35.9 percent more than a year ago. The first place in sales is traditionally russian manufacturer KamAZ. Its share in the total mass of trucks was 30%, that is, 1.5 thousand units. However, this is 5.6 percent less than in January 2017. GAZ is in second place, sales of which amounted to 587 cars. The third place is taken by the Swedish "Volvo", which accounted for 406 purchased cars. The sales of the Belarusian MAZ and the Swedish Scania are somewhat less significant.

The highest growth was recorded in Hino and Volvo (over 100 percent). The decrease is typical only for KamAZ. In general, in the market structure freight transport the share of foreign manufacturers is growing.

Car market forecast
In 2017, after four years of decline, there was a 12.5% \u200b\u200bincrease in sales. As for 2018, according to forecasts, the sold cars will increase by another 11%. Their number will be 1.64 million transport units. Share domestic cars in the sales structure will remain unchanged at 83%.
The freight transport market is also expected to grow. It can be 10% and reach 88 thousand pieces. For buses, this figure will be 16%.
Conclusion
Thus, the article answered the question of how many cars are in Russia. The situation with the automotive market was also described.
Based on all this information, we can conclude that there is a steady increase in the number of cars in Russia. The level of motorization is also growing rapidly, gradually approaching the indicators of developed countries. Accordingly, problems are growing: traffic jams, lack of space, air pollution, and so on.
The share of domestic products in the general car market is large.
The highest level of motorization takes place in the Primorsky Territory, and Moscow is far behind on this list, which indicates the commitment of many Muscovites public species transport.
Car sales have declined slightly in recent years, but an upward trend has emerged since 2017. Forecasts for 2018 predict continued positive dynamics. The most popular is Lada.
The market for electric vehicles in the country is still in its infancy and cannot be compared with that in several other countries of the world. More important for our country is the transition to gas fuel, which is going on quite actively.
Truck sales have grown significantly over the past year and a half. KamAZ is still among the leaders, but its share is decreasing.
In the USA in 1901 there were 10,000 vehicles... It took five years to multiply that number by 10.
In 1906, there were 100,000 motor vehicles in the United States. After 7 years
In 1913, there were 1,000,000 motor vehicles in the United States. After 8 years
In 1921, there were 10,000,000 motor vehicles in the United States. After 47 years
In 1968, there were 100 million motor vehicles in the United States.
In 1994, there were 200,000,000 motor vehicles in the United States.
The peak came in 2008 with 255,917,664 vehicles. Since then, there have been no more cars in the United States.
With the USSR, everything is much more complicated. There are no transparent statistics. And the one that is, lies at every corner. Let's take a look at the data from the reference National economy USSR.
Officially, in 1980, at the peak of car production in the USSR 250 million, as many cars were produced as in the US 100 million when grandfather Lenin died.
The results are appropriate.
10,000 cars were reached by 1913.
100,000 vehiclesin the USSR it was about 1934. (thanks to the Ford plant transported to the USSR)
1,000,000 vehicles. was by 1948. (Thanks to Lend-Lease and reparations)
10 million vehicles were in the USSR by 1978. (Thanks to the Italians who built Avtovaz)
It seems like by 1990 there were 21 million vehicles in the USSR. 17 million cars and 4 million trucks. But there are big doubts about this figure.
And let's take 1988 as an example. 1262 thousand cars were produced, 341 thousand were sent for export. Remaining 832 thousands of cars. The vehicle fleet this year has grown by 830.9 thousand cars. It turns out that only a thousand cars were lost in accidents and old age in a year. soviet cars were unkillable. It may well be said that the USSR imported cars. But then the export figures that the communists boast about go to the trash. But most likely the statistics of the USSR were cheating with sales, considering secondary market commissioners. And selling cars twice as much as produced, I counted them in an increase in the vehicle fleet. Comrade did a little research from which it follows 
That instead of 60 cars per thousand people, there were a third less cars, about 35 cars per 1000 people. A car in 1990 in the USSR was not 17 million, but only 10. Accordingly, in the RSFSR only 5 million instead of 7.254.
Well, since 1985 the vehicle fleet of the USSR began to decrease.
Number of cars per capita: pink - calculated value, cyan - official.
The crisis period led to significant changes in the Russian vehicle fleet. By 2014 registration passenger carspurchased in the showroom fell 44.2%. , these indicators corresponded to the situation in 2005.However, already in 2015, a tendency towards stabilization of registration data became noticeable, as evidenced by statistics: by the end of the year, the passenger car fleet increased by 6.3%, which in quantitative terms amounted to approximately 1,280,000 units technology. It is worth noting that the cost of a new car increased by 56-57 thousand compared to 2014 and amounted to 1 million 56.7 thousand rubles.
How many cars were registered in 2016?
Motorization of the state, albeit at a slower pace due to sanctions and the crisis, continued in early 2016. There were 283 registered cars for every 1,000 Russians, which is 11 more than a year ago. Primorye and Kamchatka Territory became the leaders in terms of car availability, which was due to the import of used Japanese foreign cars through the Far East. There was a decline in re-exports, when residents of neighboring countries bought cars in Russia (the ruble exchange rate made such purchases profitable for those who saved for a car in dollars), but registered on the territory of their countries. According to the State Traffic Inspectorate, at the end of February 2016, the growth in the number of registered cars was 1.5% compared to the same period in 2015. Indicators of the official traffic police resource indicate that over 10 years, the Russian car fleet has grown by about 65%. Statistics on the types of registered vehicles are presented in Table 1.
Table 1 - Number of registered cars in Russia as of July 2016, million units
| A type vehicle
|
Share,% |
Number of cars |
|---|---|---|
| Cars |
83,6
|
41,08
|
| Light commercial vehicles |
8,04
|
3,95
|
| Trucks |
7,51
|
3,69
|
| Buses |
0,79
|
0,39
|
| Total |
100
|
49,11
|
According to the analytical agency "Autostat"
The head of the press department of the analytical agency "Autostat" A. Timerkhanov noted that the provision of vehicles in the Russian Federation is much lower than in european states, USA. However, according to the expert, the indicators are growing every year, despite the negative market dynamics of the crisis period. The average age of a passenger car is 12.5 years, but more than a third of the car park has already crossed the 15-year mark. About 58% of passenger cars are foreign made, and 20% of the fleet consists of SUVs and crossovers. Data on registration of cars and trucks in some regions of Russia are presented in Table 2.
Table 2 - Number of cars and trucksregistered in the regions as of 01.07.2016
| Region |
Passenger cars, mln. |
Trucks, thous. |
|---|---|---|
| Moscow |
3,799
|
177
|
| Moscow region |
2,536
|
144,8
|
| Krasnodar region |
1,677
|
135
|
| Rostov region |
1,236
|
111,2
|
| Republic of Tatarstan |
1,188
|
105,4
|
According to the analytical agency "Autostat"
At the end of 2016, 395.4 thousand buses were registered in the Russian Federation. As of January 1, 2017, more than 19 thousand buses were registered in the capital, the Krasnodar Territory was in second position with an indicator of 15.8 thousand, in the third step - the Moscow Region, where 14.5 thousand units were registered. About 10 thousand were registered in St. Petersburg, the Republic of Tatarstan, Novosibirsk, Irkutsk regions. More than 70% of buses are owned by legal entities, 27% of the total are foreign-made cars. Bus depot in Russia, 45% consists of equipment over 45 years old.
How many vehicles were registered in 2017?
The indicators of 2017 demonstrated the growth of the Russian car fleet and an increase in the purchasing power of citizens. According to the estimates of the Association of European Businesses, in the first half of 2017, about 849 thousand passenger cars and commercial vehicles were sold, which is 8.5% higher than the figures for the same period in 2016. There were 400 cars per 1000 people in the capital, as evidenced by statistics traffic police data. These are the highest rates of motorization in the regions of the Russian Federation. At the end of 2017, the number of registered vehicles increased by almost one and a half percent compared to 2016. Data by types of vehicles are presented in Table 3.
Table 3 - Number of registered vehicles in Russia as of January 2018, million units
| Vehicle type |
Share,% |
Number of cars |
|---|---|---|
| Cars |
79
|
44,1
|
| Motorcycles |
3,6
|
2
|
| Trucks |
10,7
|
6
|
| Buses |
0,56
|
1
|
| Total |
100
|
56
|
According to the analytical agency "Autostat"
The capital and the Moscow Region were the leaders in terms of vehicle provision, where, as of January 2017, more than 6 million vehicles were registered. Such indicators exceed the data of 2016 by 300,000 pcs. Statistics on the registration of cars, trucks and buses in some regions of Russia are presented in Table 4.
Table 4 - The number of cars, trucks and buses registered in the regions as of 01.07.2017
| Regions |
Passenger cars, mln. |
Trucks, thous. |
Buses, thous. |
|---|---|---|---|
| Moscow |
3,75
|
171
|
19,7
|
| Moscow region |
2,59
|
149,3
|
14,6
|
| Krasnodar region |
1,72
|
137,3
|
16
|
| Rostov region |
1,26
|
112,2
|
12,2
|
| Republic of Tatarstan |
1,2
|
107,2
|
13,2
|
According to the analytical agency "Autostat"
About 59% of passenger cars are foreign cars, and the average age of a car is over 12.5 years. Moreover, 1/3 of all passenger cars are over 15 years old. Trucks are even older, with an average age of almost 20 years, and 2/3 of vehicles are over 15 years old. Legal entities own 53% of the Russian cargo vehicle fleet. The average age of Russian buses is 15.5 years, with almost half being over 15 years old. 72% of the total bus fleet is registered on legal entities... Foreign-made buses do not exceed a third of the total number of vehicles, while environmental requirements the Euro-4 level corresponds to only 15%.
Conclusion
The last decade, according to the traffic police, has been marked by an increase in the private car fleet by 65%. The traditional increase in registration is one and a half percent, which is typical for the post-crisis years. The capital and the Moscow region are the leaders in terms of vehicle availability, which leads to an increase in traffic jams and accidents on the roads. At the same time, against the background of world capitals, Moscow looks very modest, since it is not among the ten cities with the most congested road system. The leaders in the number of registrations are cars, trucks and motorcycles are significantly inferior to them, and buses are among the outsiders.
According to the analytical agency "AUTOSTAT", as of July 1, 2016, the security passenger cars the average for Russia was 285 units per 1000 inhabitants.
The richest regions are Kamchatka (472 units) and Primorsky (437 units) Territories. One of the reasons for such high rates of these subjects of the Russian Federation is the fact that used foreign cars are imported from Japan through the Far East. The third place in terms of the provision of passenger cars is taken by the Moscow region (347 units).
Kaliningrad (344) and Kaluga (342) regions close the top five. The TOP-10 regions in terms of supply also included: Karelia (341 units), Pskov region (336 units), Khanty-Mansi Autonomous Okrug - Yugra (327 units), Ryazan (324 units) and Murmanskaya (321 units) area.
It should be noted that Moscow is in 22nd position in this rating (308 items), St. Petersburg - 11th (316 items). The lowest provision of cars in Russia is in Chukotka Autonomous Okrug: 88 cars per thousand inhabitants. Also, the experts of the agency "AUTOSTAT" note that in 36 regions (out of 83) the indicator of the provision of passenger cars is higher than the national average.
“The provision of cars in Russia is still significantly lower than in developed European countries and the United States. At the same time, it is increasing from year to year. For example, two years ago (as of July 1, 2014) the provision of passenger cars on average in Russia was 280 units per thousand inhabitants. Thus, over the past two years, even in the absence of positive market dynamics, this indicator continued to grow, ”he noted. Azat Timerkhanov, head of the press service of the analytical agency AUTOSTAT.
| № | region | provision for 1 thousand people |
| 1. | Kamchatka Krai | 472 |
| 2. | Primorsky Krai | 437 |
| 3. | Moscow region | 347 |
| 4. | Kaliningrad region | 344 |
| 5. | Kaluga region | 342 |
| 6. | Karelia | 341 |
| 7. | Pskov region | 336 |
| 8. | Khanty-Mansi Autonomous Okrug (Yugra) | 327 |
| 9. | Ryazan region | 324 |
| 10. | Murmansk region | 321 |
| 11. | St. Petersburg | 316 |
| 12. | Sakhalin Region | 315 |
| 13. | Oryol region | 314 |
| 14. | Tver region | 314 |
| 15. | Orenburg region | 314 |
| 16. | Belgorod region | 313 |
| 17. | Tambov region | 311 |
| 18. | Tyumen region | 311 |
| 19. | Smolensk region | 310 |
| 20. | Yamalo-Nenets Autonomous District | 309 |
| 21. | Samara region | 309 |
| 22. | Moscow | 308 |
| 23. | Novgorod region | 308 |
| 24. | Khakassia | 308 |
| 25. | Tatarstan | 307 |
| 26. | Voronezh region | 307 |
| 27. | Lipetsk region | 304 |
| 28. | Krasnodar region | 304 |
| 29. | Kurgan region | 302 |
| 30. | Tula region | 300 |
| 31. | Magadan region | 293 |
| 32. | Rostov region | 292 |
| 33. | Vologda region | 291 |
| 34. | Chelyabinsk region | 291 |
| 35. | Komi | 290 |
| 36. | Krasnoyarsk region | 289 |
| 37. | Leningrad region. | 284 |
| 38. | Kursk region | 284 |
| 39. | Irkutsk region | 283 |
| 40. | Saratov region | 282 |
| 41. | Omsk region | 281 |
| 42. | Sverdlovsk region. | 281 |
| 43. | Tomsk region | 281 |
| 44. | Bashkortostan | 277 |
| 45. | Novosibirsk region | 276 |
| 46. | Kostroma region | 273 |
| 47. | Udmurtia | 272 |
| 48. | Adygea | 271 |
| 49. | Astrakhan region | 270 |
| 50. | Nizhny Novgorod region. | 268 |
| 51. | Vladimir region | 266 |
| 52. | Penza region | 265 |
| 53. | Ulyanovsk region | 263 |
| 54. | Altai region | 263 |
| 55. | Volgograd region | 261 |
| 56. | Stavropol region | 261 |
| 57. | Arkhangelsk region | 257 |
| 58. | Yaroslavl region | 256 |
| 59. | Kirov region | 253 |
| 60. | Mordovia | 241 |
| 61. | Nenets Autonomous District | 240 |
| 62. | Transbaikal region | 239 |
| 63. | Amur region | 239 |
| 64. | Bryansk region | 237 |
| 65. | North Ossetia Alania) | 235 |
| 66. | Kemerovo region. | 234 |
| 67. | Perm region | 231 |
| 68. | Kalmykia | 228 |
| 69. | Khabarovsk region | 227 |
| 70. | Jewish Autonomous Region | 224 |
| 71. | Ivanovo region | 221 |
| 72. | Altai | 220 |
| 73. | Mari El | 214 |
| 74. | Kabardino-Balkaria | 213 |
| 75. | Chuvashia | 212 |
| 76. | Yakutia (Sakha) | 203 |
| 77. | Buryatia | 196 |
| 78. | Karachay-Cherkessia | 182 |
| 79. | Tyva | 181 |
| 80. | Dagestan | 171 |
| 81. | Ingushetia | 142 |
| 82. | Chechnya | 131 |
| 83. | Chukotka Autonomous Okrug | 88 |
| TOTAL in Russia | 285 |